In the competitive landscape of retail speculation, the placement of a stop-loss order is often treated as an emotional afterthought. Most traders deploy arbitrary, fixed pip boundaries derived from cognitive shortcuts rather than raw market metrics. To build an institutional edge, an operator must recognize that optimal invalidation zones are dynamic, non-linear vectors. By marrying structural Market Anatomy (Swing Highs and Swing Lows) with Statistical Volatility Models (Average True Range), a quantitative framework can be built to shield positions from standard liquidity sweeps.
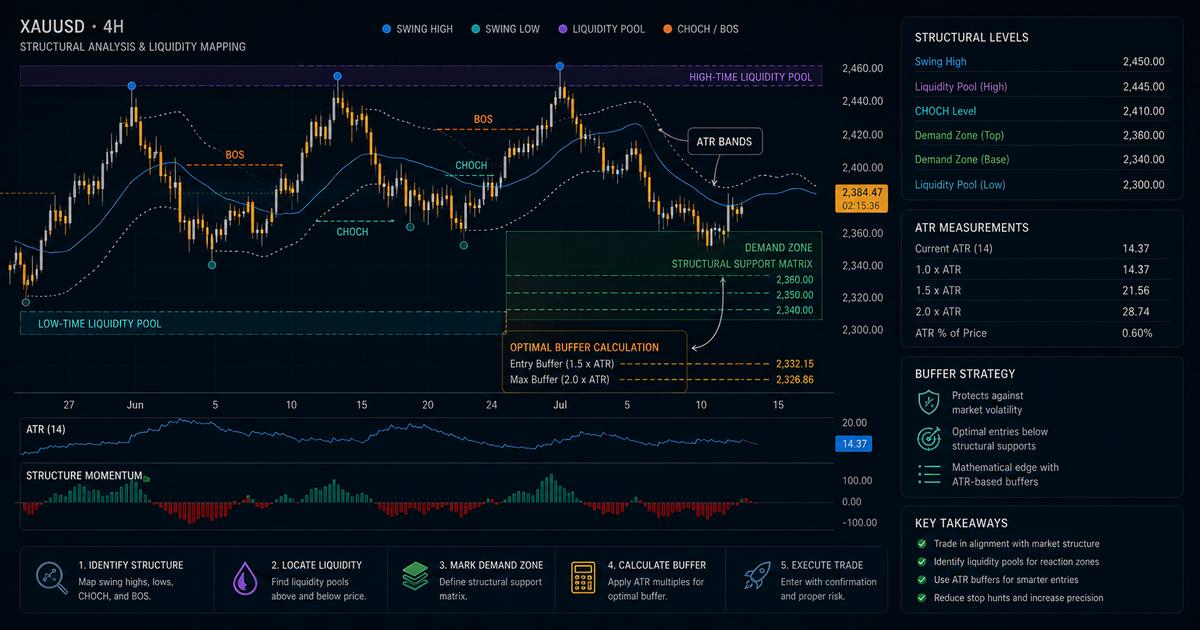
The Failure of Arbitrary Invalidation Zones
Executing a uniform "20-pip stop loss" across varying price distributions or market cycles is a mathematical recipe for account degradation. Financial markets are fluid; their breathing cycles change based on shifting volume distributions, macroeconomic releases, and geographical session shifts.
When you ignore localized asset volatility, your invalidation points will either be too narrow—resulting in quick stop-outs caused by basic spread expansion—or too wide, destroying your capital efficiency. Once a technical exit point is accurately defined by combining structure and variance, it must be linked directly to your core position equations. To explore how to smoothly calculate your final exposure based on these shifting technical boundaries, read our foundational centerpiece analysis on The Mathematics of Position Sizing: Managing Risk in High-Volatility FX and Gold Markets.
Phase 1: Mapping Market Structure (The Foundation)
The first step in calculating a professional-grade stop-loss relies on structural price action. Markets move in structural expansion waves, printing key swing mechanics:
- Bullish Formations: Stop-losses are anchored underneath the valid Swing Low that initiated the structural break to the upside (BOS/CHoCH).
- Bearish Formations: Stop-losses are anchored directly above the prominent Swing High that initiated the downward expansion wave.
However, smart money algorithms target these exact structural highs and lows to sweep liquidity pools before continuing a directional move. To prevent getting caught in these intentional market traps, anchoring your exit strictly to the technical swing point is insufficient—you must apply a statistical volatility offset.
Phase 2: Factoring in Average True Range (ATR)
The Average True Range (ATR) indicator is a non-directional mathematical calculation that measures market variance over a set period (typically using a 14-period baseline). It quantifies the market's standard breathing capacity in real time.
By factoring a multiplier of the ATR into your structural invalidation level, you place your order completely outside the boundary of normal market noise. The formula for calculating a volatility-adjusted exit point is structured as follows:
For optimal risk optimization, professional systematic operators utilize the following volatility distributions:
- 1.0x ATR Multiplier: Used during stable trend environments or low-liquidity sessions to maintain clean risk-to-reward matrices.
- 1.5x to 2.0x ATR Multiplier: Deployed inside highly volatile assets like Spot Gold (XAUUSD) or during volatile overlapping market sessions to survive deep liquidity sweeps.
The Execution Flow: A Concrete Trading Scenario
Let’s dissect an intraday long setup on GBPUSD to see how this dual-layered mathematical approach operates in real-world environments:
● STEP 1: Identify structural order block entry price at 1.3350.
● STEP 2: Locate the technical protective Swing Low point on the chart at 1.3320 (Base distance = 30 pips).
● STEP 3: Check current ATR (14) value on the terminal, which registers at 12 pips.
● STEP 4: Apply a standard 1.0x ATR variance buffer to your protective anchor level.
● FINAL CALCULATION: 30 Pips (Structural Distance) + 12 Pips (ATR Value) = 42 Pips Total Stop-Loss Distance.
Because your final exit distance has expanded from 30 to 42 pips to absorb market volatility, your position sizing module must automatically adjust. Your lot allocation size scales down proportionally, perfectly guaranteeing that a loss retains the exact same 1% risk threshold allocated to your portfolio strategy.
Resolve Shifting Stop-Loss Dimensions
Input your combined structure and ATR distances below to solve for your exact terminal lot allocations in real time.
Forex Position Size Calculator
Amount at Risk: $0.00
Strategic Execution Restrictions
To maintain strict capital preservation and successfully navigate prop firm evaluations or live environments, enforce three rules:
- The Rule of Real-Time ATR Tracking: Always read the ATR indicator on the specific timeframe your setup is executed to prevent cross-timeframe variance mismatch.
- No Mid-Trade Stop Adjustments: Once your structure-plus-ATR stop-loss is placed and transmitted to the terminal, adjusting or widening the bracket during active trade delivery is strictly forbidden.
- High-News Multiplier Scale: Double your standard ATR multiplier requirement (e.g., scaling from 1.0x up to 2.0x) if executing setups within a 30-minute window of high-impact news releases.
Conclusion: Systematize Your Edge
Professional consistency is born when emotional decision-making is completely extracted from your execution platform. Transitioning away from arbitrary fixed stops and implementing structure-plus-ATR invalidation layers completely removes the element of guesswork. You strip away the psychological pain of market drawdowns, ensuring your trading operation survives to exploit systemic probabilities over a massive sequence of executions.
Volatility Invalidation & Structure FAQ
Why shouldn't I use a fixed pip stop-loss across all setups?
Using a fixed pip stop-loss completely ignores daily market environment changes. A 20-pip stop might be perfect during low-volatility Asian sessions but will get wiped out instantly by noise during NY sessions or high-ATR environments like Spot Gold.
How does the ATR indicator prevent broker hunting and market noise?
The Average True Range (ATR) measures market variance. By adding an ATR buffer (e.g., 1.0x or 1.5x ATR) below a structural Swing Low, you place your exit order outside the statistical boundary of normal market noise and temporary liquidity sweeps.
Do I change my lot size when my ATR stop-loss distance expands?
Yes, absolutely. To maintain strict risk control, your lot allocation must scale inversely to your technical stop-loss distance. As the technical stop expands, your position size calculator must output a smaller lot size to keep total dollar risk constant.