Amateurs guess; professionals test. In modern retail trading, the gap between persistent losses and systemic wealth generation is bridged exclusively by robust historical simulation and statistical validation.
The Paradigm Shift: From Market Prediction to Statistical Modeling
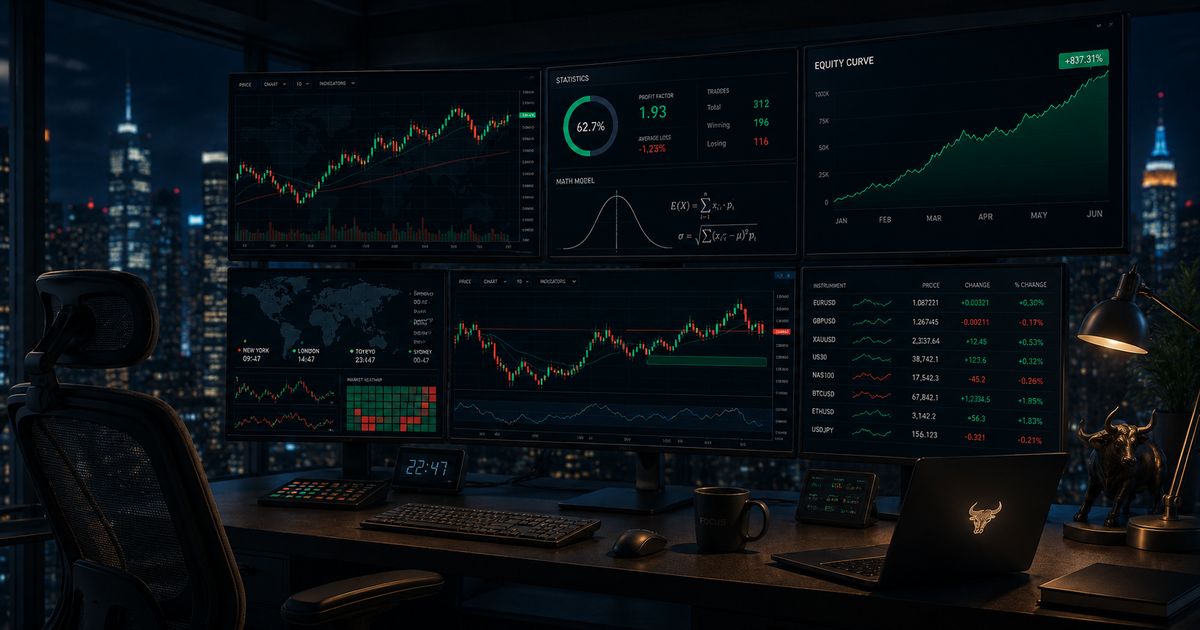
The psychological fatal flaw of the retail trader is the obsession with predicting the future. Millions enter the market daily looking for signs, secrets, or internal confirmations that guarantee where price is moving next. Professional algorithmic operators completely discard this narrative. They treat price action not as a puzzle to be solved, but as a distribution of historical probabilities.
Backtesting is the mechanical practice of applying your rigorous trading rules—such as explicit 200 EMA trend filters or precise Demand Zone parameters—to historical data across years of real market fluctuations. This process shifts your mindset from "I think the market will buy here" to "Historically, this explicit structural configuration yields a 58% win rate with a 1:2 risk-to-reward ratio over a 10-year block."
The Core Metrics of Financial Longevity
When you execute a rigorous historical system test, your focus must move past raw profit figures. True portfolio performance data resides within three institutional metrics:
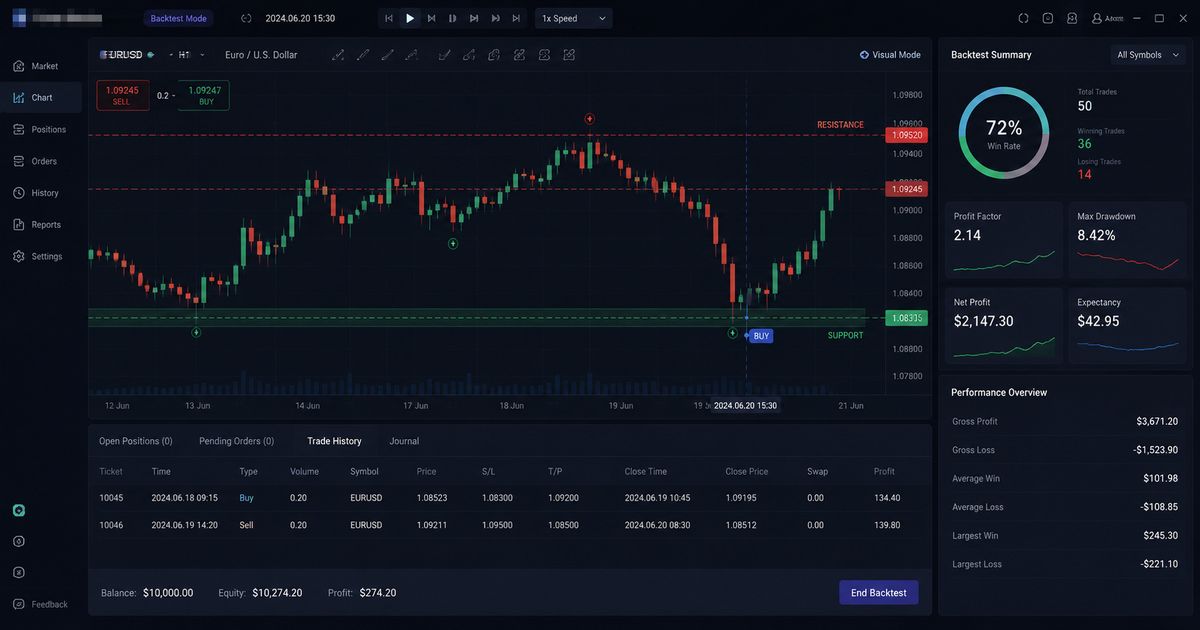
- Profit Factor: The ratio of gross profits divided by gross losses. An institutional-grade framework requires a Profit Factor above 1.5, meaning your winning executions significantly outweigh your operational losses.
- Maximum Drawdown (Max DD): The peak-to-trough decline of your equity curve. If your strategy encounters a 40% drawdown during a volatile market shift, it violates the stringent 5% daily limits of elite proprietary firm evaluation challenges.
- Mathematical Expectancy: The net expected dollar return per individual transaction. A positive expectancy proves that over a long sequence of iterations, your edge will inevitably generate capital compounding.
Crucial Risk Prerequisite
An optimized drawdown report is impossible without accurate contract volume allocation. If you haven't mastered lot calculation parameters yet, read our foundational blueprint.
Master the Math: Position Sizing 101 & Prevent Account Drawdowns →🏆 Prop Firm Note: Understanding your backtested historical drawdown parameters is the single most critical asset when attempting to pass institutional funding evaluations. Read our tactical framework on Prop Firm Mastery: Navigating Rules & Passing Evaluation Challenges to discover how to align your statistics with corporate risk requirements.
The Manual Struggle: Why Scrolling Backwards is Ruining Your Edge
Many active participants believe they are backtesting by opening a standard chart, scrolling backward through historical data on TradingView, and manually noting where a setup would have won. This amateur method introduces two severe structural errors:
First, it breeds rampant Look-Ahead Bias. When your eyes can sub-consciously perceive the massive bullish expansion that occurs on the right side of the screen, your mind will naturally find a reason to validate the long entry pattern, completely invalidating the statistical integrity of the experiment.
Second, it completely ignores the elements of execution friction, spread expansion, and real-time decision fatigue. To build bulletproof confidence, you must make blind, forward-moving trading decisions in a dynamic simulation environment that perfectly matches live execution.
Eliminate the Friction: Accelerate Practice with Dedicated Simulation
To accumulate the 10,000 hours of professional execution proficiency required to achieve master-level status, relying exclusively on live market hours is a massive tactical error. The live market offers slow, inefficient feedback, forcing you to wait days or weeks for structural patterns to manifest.
Professional quantitative traders bridge this operational gap by deploying dedicated market simulator software. Specialized desktop ecosystems—most notably Forex Tester—allow you to compress years of historical tick-by-tick data down into a matter of hours. You can accelerate execution speed, pause active price feeds, adjust multi-timeframe correlation points seamlessly, and execute hundreds of blind trades over historical market regimes (such as the high-volatility environments of 2026) within a single afternoon.
By simulating your exact structural parameters over decades of historical market periods, your execution moves from a place of hesitation to instinctive precision. You eliminate the emotional anxiety of drawdowns because you have already witnessed your system survive and thrive through similar historical periods thousands of times before.
The Professional Shortcut to Market Mastery
Stop practicing on live capital. Use Forex Tester to backtest strategies, gain 10 years of market experience in days, and export comprehensive statistical performance reports instantly.Conclusion: Building An Unshakable Trading Mindset
Confidence in the live markets is not a byproduct of positive thinking or arbitrary motivation. It is the direct mathematical result of data verification. When you possess a comprehensive backtesting report that verifies your structural methodology survives historical volatility, your daily operational stress drops to zero.
Treat your trading like an elite data-driven business. Stop entering positions based on feeling, and start building your definitive historical database today.
Backtesting Methodology FAQ
How many trades are required for a valid backtest sample?
To achieve statistical significance and eliminate random market noise, a professional backtest sample must consist of a minimum of 100 to 200 consecutive trades across diverse market environments.
What is the difference between manual scrolling and a dedicated software simulator?
Manual scrolling on platforms like TradingView introduces look-ahead bias and structural fatigue. A specialized simulator like Forex Tester forces you to make blind execution decisions in a fully dynamic, historical environment, accurately mirroring live execution.
Which statistical metrics are critical in a backtesting report?
Traders must monitor three core metrics: Profit Factor (ideally above 1.5), Win Rate combined with Risk-to-Reward Ratio, and Maximum Drawdown to ensure the strategy remains within psychological and proprietary firm boundaries.